It's the turn of a new year and we take this opportunity to wish our readers a prosperous & plentiful year of the pig. In the midst of the festivity, we'd thought it is a good time to look forward on what the near term might bring for the Singapore residential market.
Private properties are a prized commodity and analogous to all markets, its prospect is a culmination of the effects in varying supply and demand situations. Here we analyse with the latest data from each angle of supply pipeline, demographics, liquidity, policy changes & market forces at play to conclude that the outlook under this current climate will be signified by very tight supply in the coming years with ample liquidity waiting to enter. This should be supportive to home prices and presents sweet-spot positioning for the near term.
Supply Pipeline
The URA periodically updates the market with a forward 6 years supply pipeline on the number of residential units under construction as well as the building permissions whether granted or provisionally granted for each of the 6 years into the future.
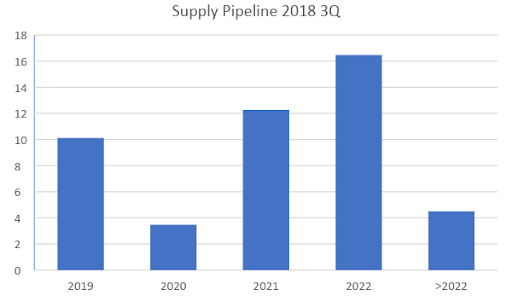
Source: Data from URA
Singapore property supply currently lingers around historical lows as this forward pipeline fell from the height of 82,776 units reached in 2012 to the absolute low of 34,914 units planned for the next 6Y to come in 2017. In short, we are constructing less homes than in 1993 on the back of a housing market that had grown 6x larger in size. Housing stocks therefore grew at the slowest pace in history at 11.98% ending 2017.
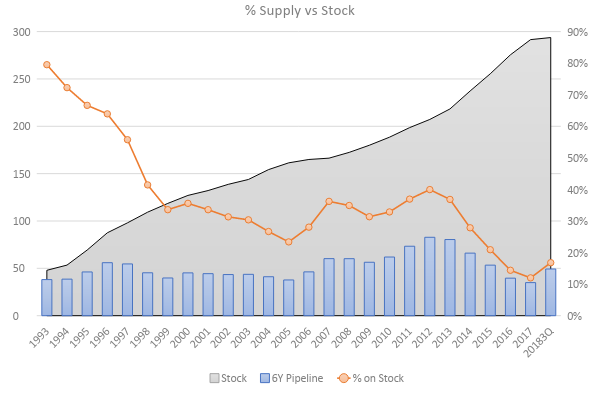
Source: Data from URA
Although latest figures published in 20183Q showed 50,330 in planned units making this a first reversal and significant increase from previous years; it is however worth noting that the bulk of these planned units were stipulated for much further into the future, this is contrary to earlier planning model when tracking URA's record since 2014 that supply is now becoming heavily backloaded. (In 2014, the furthest 3 of the 6 years accounted only for 17% of total announced supply vs 66% of the recently published 20183Q supply were targeted for 2020 onwards)
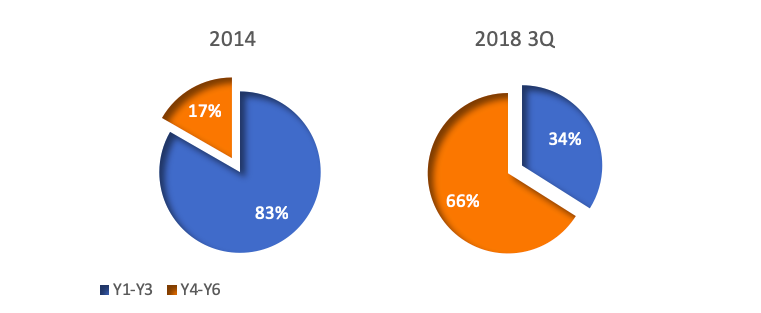
Source: Data from URA
The real supply scenario despite the announced pipeline increase can therefore be described as extremely tight for the near term marked by sharp drops in new completions. New units planned for year 2020 also come just under 3,500 units.
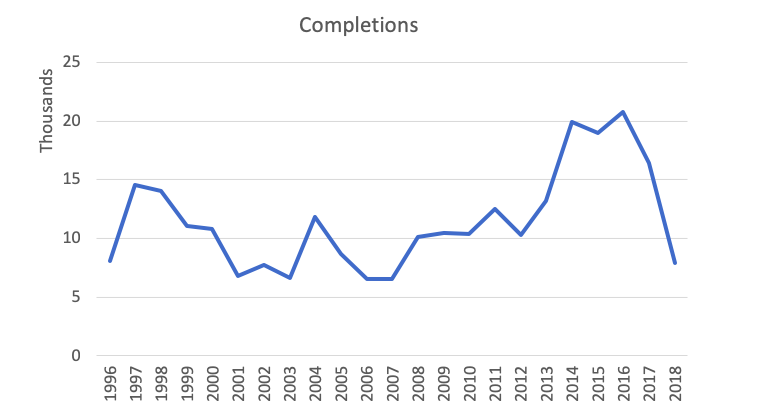
Source: Data from URA
Vacancy & Demographics
Vacancy situations in the private residential sector is thought to be a key policy driver on URA's supply pipeline planning. Private residential vacancy is a function of the change in housing stock (how many new units are being pushed to the market) and the change in population (how quickly the home units are occupied by new households).
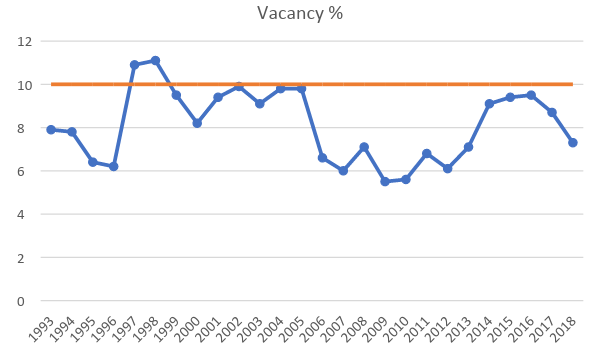
Source: Data from URA
Given Singapore's policy bias that availed public housing to 80% of local dwellings; one population group in particular, the Non-Resident Population is pivotal when it comes to private condo consumptions.
Although vacancy data had improved in recent quarters, there are signs of a waning Non-Residents population seen in 2 consecutive yearly decline in numbers. Interestingly, a decrease in non-residents number is historically rare. Data since 1991 seen only 2 such occasions during the 1999 Asian Financial Crisis & 2002-2003 bursting of dot-com bubble & SARS where foreigners were exiting Singapore. This current episode of Non-Resident population decline is itself a curious case that is independent of any external economic shock.
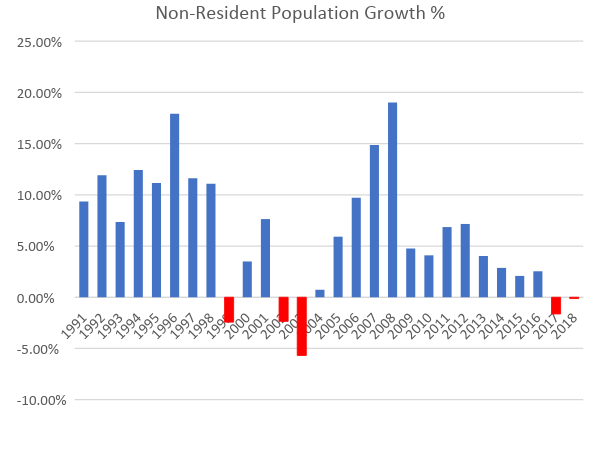
Source: Data from Singapore Department of Statistics
Nonetheless, in the absence of any gross change in the dwelling habits of Singaporeans, a decline in numbers of the biggest consumer group of private residential housing will have an overall effect on vacancy and only serves to soften the case for further supply easing by policy makers.
Liquidity & the Private Residential Market
The Singapore Private Residential market after hitting its absolute highest level in 2013 Q3 had since endured a slow 15 straight quarters of consolidation, with the URA home price index falling 10.2% from its peak to bottom out in 2017 Q2, where it was abated with a fierce rebound registering a 9.3% comeback within the year of 2018.
The fall in home price which had already been foreshadowed by a significant drop in home sales volume prior to its 2013 peak was followed by a dismal 2014 in market activities. Private residential sales bottomed at 2,655 transactions in 2015 Q1 and had recovered to a sustained level of over 6,000 in average quarterly sales since 2017 Q4.
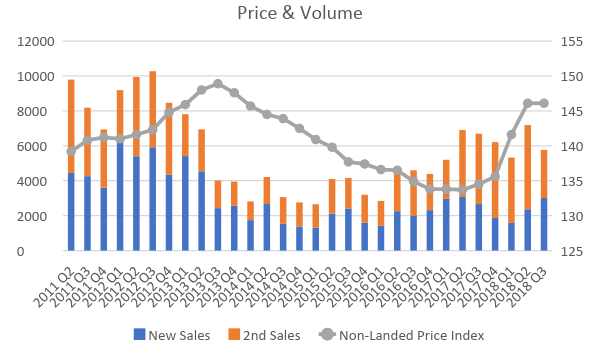
Source: Data from URA
Evidently a series of government interventions widely known as the "cooling measures" had arrested the home price appreciation in Singapore by introducing an array of additional stamp duties and restricting the amount of borrowings available by lowering the LTVs allowed in home loans. The diminished purchasing power ensued the long period of consolidation but it had a knock-on effect of strengthening the household balance sheet as Singaporeans have been accumulating record amount of wealth in cash & its equivalent. Put simply, the blockade to properties market access did not cause savings to be diverted to investments in other asset classes as the level of deposits at Singapore Financial Institutions grew exponentially in this period.
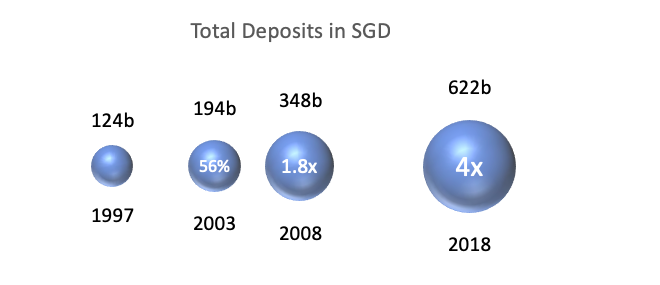
Source: Data from Bloomberg
The potential on the buy-side of the Singapore residential market is therefore awash with liquidity from years of savings as showcased by the fierce rebound in early 2018 with many buyers ready to act on first sign of recovery.
by Herbert Woo Founder of MicroProperties
wherb@mymicroproperties.com
Disclaimer: This document is not an advertisement and does not constitute or form part of any offer or solicitation to issue, sell, subscribe or purchase any investment nor shall it or the fact of its distribution form the basis of or be relied on in connection with, any contract for the same. The contents in this document are for information, illustration or discussion purposes only and should not be construed as a recommendation to buy or sell any investment product and do not purport to represent or warrant the outcome of any investment product, strategy program or product. Reference to individual companies or any securities or funds is purely for the purpose of illustration only and is not and should not be construed as a recommendation to buy or sell, or advice in relation to investment, legal or tax matters.
Any research or analysis used to derive, or in relation to, the above information has been procured by MicroProperties for its own use, without considering the investment objectives, financial situation or particular needs of any specific investor, and may have been acted on for MicroProperties own purpose.
MicroProperties does not warrant the accuracy, adequacy or completeness of the information herein and expressly disclaims liability for any errors or omissions. The information is given on a general basis without obligation and on the understanding that any person acting upon or in reliance on it, does so entirely at his or her own risk. Past performance is not indicative of future performance. Any projections or other forward-looking statements regarding future events or performance of countries, markets or companies are not necessarily indicative of, and may differ from, actual events or results. MicroProperties reserves the right to make changes and corrections to the information, including any opinions or forecasts expressed herein at any time, without notice. No reliance may be placed for any purpose on the information and opinions contained in this document or their accuracy or completeness.
This document may not be reproduced in any form without the express permission of MicroProperties and to the extent it is passed on, care must be taken to ensure that this reproduction is in a form that accurately reflects the information presented here.